
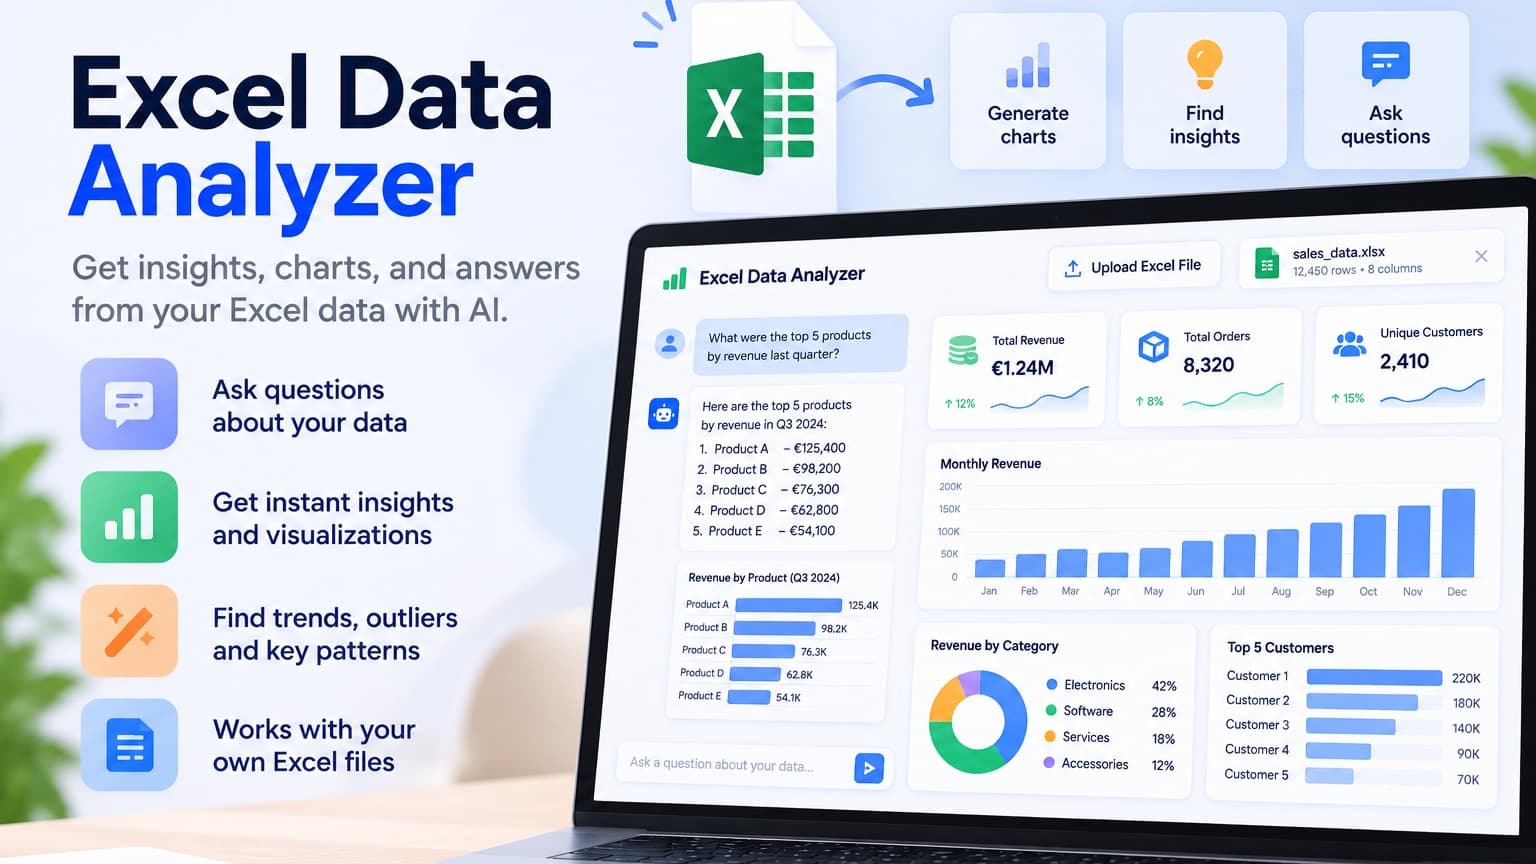
Excel Data Analyzer helps users explore and understand spreadsheet data without writing complex formulas or manually creating reports.
Users can upload an Excel file and ask questions about their data in natural language. The AI analyzes the spreadsheet and returns clear answers, summaries, calculations, and visualizations.
The tool can also identify trends, unusual values, key patterns, and important changes in the dataset.
It can be used as a foundation for building AI-powered analytics tools, internal reporting assistants, or self-service business intelligence applications.
Key Features
Upload and analyze Excel files
Ask questions about data in natural language
Automatic chart generation
KPI and summary generation
Trend and pattern detection
Outlier identification
Data filtering and aggregation
Support for multiple Excel sheets
AI-generated business insights
Export analysis results
Example Use Case
Imagine a sales manager has an Excel file containing thousands of sales transactions.
Instead of manually creating pivot tables and formulas, they can upload the file and ask:
“Which five products generated the most revenue last quarter?”
or:
“Show me the monthly revenue trend and identify any unusual changes.”
The assistant analyzes the spreadsheet, calculates the results, and generates a clear answer with relevant charts.
Who is it for?
This asset is useful for business analysts, founders, sales teams, finance teams, consultants, operations teams, and professionals who regularly work with Excel data but want faster insights.
What you get
Python source code, Excel processing pipeline, AI analysis components, example prompts, sample Excel datasets, visualization examples, configuration files, and setup instructions.